用 CSS 背景定位做出圓柱型數據報表
編輯:布局實例
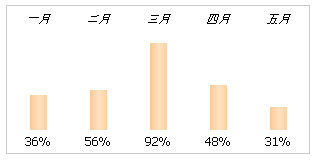
這裡示範一個純 CSS 的圓柱型報表:本質上是透過控制背景圖的裁切範圍,讓同一張柱狀圖素材露出不同高度,營造出高低差異的視覺。原理簡單,但很能說明「背景定位」這個技巧的威力。
完整程式碼
<!DOCTYPE HTML PUBLIC "-//W3C//DTD HTML 4.01 Transitional//EN">
<html>
<head>
<title>圓柱型數據報表</title>
<meta http-equiv="Content-Type" content="text/html; charset=utf-8">
<style type="text/css">
.chart {
  font-family: Tahoma; font-size: 12px;
  border: 1px solid #ccc; float: left;
  margin: 0; padding: .4em .1em;
}
.chart li {
  list-style: none; float: left; width: 5em; text-align: center;
  background: url(https://files.jb51.net/file_images/article/201505/2015512175921323.gif)
              center 1.6em no-repeat;
}
.chart li span {
  display: block; text-indent: -999em; padding-bottom: 90px;
  background: url(https://files.jb51.net/file_images/article/201505/2015512175912559.gif)
              center -1px no-repeat;
  border-top: 5px solid #fff;
}
.chart strong { display: block; text-align: center; font-weight: normal; }
</style>
</head>
<body>
<ul class="chart">
<li><em>一月</em><span style="background-position: center -35">:</span><strong>36%</strong></li>
<li><em>二月</em><span style="background-position: center -40">:</span><strong>56%</strong></li>
<li><em>三月</em><span style="background-position: center -87">:</span><strong>92%</strong></li>
<li><em>四月</em><span style="background-position: center -45">:</span><strong>48%</strong></li>
<li><em>五月</em><span style="background-position: center -23">:</span><strong>31%</strong></li>
</ul>
<p style="clear: both"></p>
</body>
</html>
原理拆解
li 上的背景是基線與刻度:那張 url 定位在 center 1.6em,讓每根柱子的底部對齊同一條水平線。
span 上的背景是柱子本體:垂直位置由行內 style 的 background-position 決定,數值越負,柱子露出的部分越長。三月 -87px 最高,五月 -23px 最矮,比例一目了然。
text-indent: -999em:把 span 裡的佔位文字推到畫面外,讓它看不見但仍佔位,這是圖像替換文字的老技巧。padding-bottom: 90px 則決定柱子的最大可視高度。
border-top: 5px solid #fff:在柱子頂端製造一道白色分隔,視覺上更有層次。
strong 顯示數值:把百分比寫在柱子下方,避免讀者只能目測估高低。
這個做法的現代替代
這套技巧的時代背景是「不能引入圖表庫」。今天若要做真正的數據視覺化,直接用 CSS 的 height 百分比更乾淨:
.bar {
  height: calc(var(--value) * 1%);   /* --value 由資料決定 */
  background: linear-gradient(to top, #4a90d9, #7fb8ea);
}
或直接用 SVG、ECharts、Chart.js 這類工具。不過理解背景定位的思路仍有價值——它在精靈圖、圖示字型之外的場景中依然常用。
運行效果如下圖:
- 上一篇文章: 一行內讓圖片與文字垂直居中對齊
- 下一篇文章: 讓同一行的文字與輸入框垂直對齊