用 Raphael 打造動態統計圖表:完整實作示範
編輯:關於JavaScript
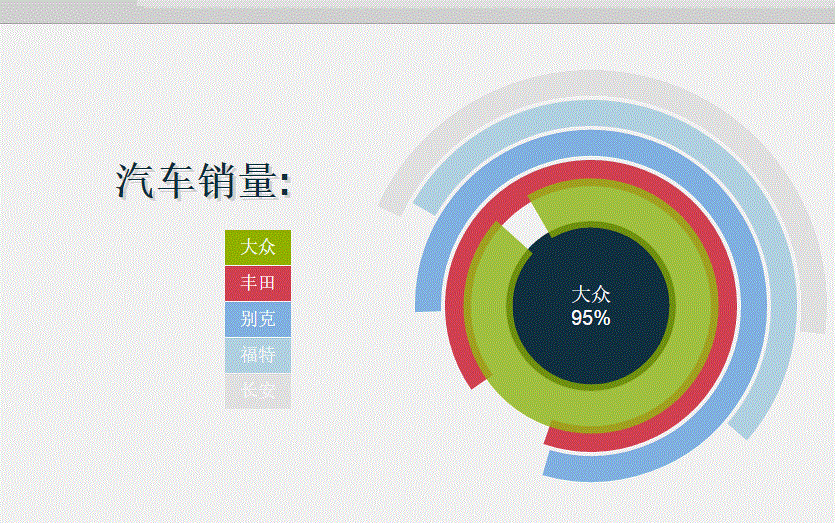
想在頁面上放一張會動的統計圖,又不打算引入整套圖表庫?這個範例用 Raphael 繪製同心圓弧,搭配少量 CSS 與 jQuery,就能做出滑鼠移入時弧線放大、中央文字同步更新的效果。以下拆解各層程式碼。
實際運行效果如下:
HTML 結構
左側是圖例清單,右側 #diagram 是畫布容器。另外準備一組隱藏的 .arc 資料列,每列存放名稱、百分比與顏色,JavaScript 稍後會讀取這些值來畫圖。
<div id="content">
  <div class="legend">
    <h1>汽車銷量:</h1>
    <div class="skills">
      <ul>
        <li class="jq">大眾</li>
        <li class="css">豐田</li>
        <li class="html">別克</li>
        <li class="php">福特</li>
        <li class="sql">長安</li>
      </ul>
    </div>
  </div>
  <div id="diagram"></div>
</div>
<div class="get">
  <div class="arc">
    <span class="text">大眾</span>
    <input type="hidden" class="percent" value="95" />
    <input type="hidden" class="color" value="#97BE0D" />
  </div>
  <div class="arc">
    <span class="text">豐田</span>
    <input type="hidden" class="percent" value="90" />
    <input type="hidden" class="color" value="#D84F5F" />
  </div>
  <div class="arc">
    <span class="text">別克</span>
    <input type="hidden" class="percent" value="80" />
    <input type="hidden" class="color" value="#88B8E6" />
  </div>
  <div class="arc">
    <span class="text">福特</span>
    <input type="hidden" class="percent" value="53" />
    <input type="hidden" class="color" value="#BEDBE9" />
  </div>
  <div class="arc">
    <span class="text">長安</span>
    <input type="hidden" class="percent" value="45" />
    <input type="hidden" class="color" value="#EDEBEE" />
  </div>
</div>
CSS 樣式
主要負責整體置中與圖例排版,圖形本身完全交給 Raphael 處理。
#content {
  position: absolute;
  top: 50%;
  left: 50%;
  margin: -340px 0 0 -450px;
  width: 900px;
  height: 600px;
}
.legend {
  float: left;
  width: 250px;
  margin-top: 140px;
}
#content h1 {
  font-family: 'Cabin Sketch', arial, serif;
  text-shadow: 3px 3px 0 #ddd;
  color: #193340;
  font-size: 40px;
  margin-bottom: 40px;
  text-align: right;
}
.skills {
  float: left;
  clear: both;
  width: 100%;
}
.skills ul, .skills li {
  display: block;
  list-style: none;
  margin: 0;
  padding: 0;
}
.skills li {
  float: right;
  clear: both;
  padding: 0 15px;
  height: 35px;
  line-height: 35px;
  color: #fff;
  margin-bottom: 1px;
  font-size: 18px;
}
JavaScript 邏輯
核心是一個名為 o 的物件,裡頭三個成員各司其職:init 負責啟動,random 產生區間隨機角度,diagram 則完成畫圖與互動。關鍵技巧在於用 customAttributes.arc 註冊自訂屬性,把「百分比」換算成一段 SVG 弧線路徑,這樣只要改變數值屬性,弧線就會重畫。
var o = {
  init: function () {
    this.diagram();
  },
  random: function (l, u) {
    return Math.floor((Math.random() * (u - l + 1)) + l);
  },
  diagram: function () {
    var r = Raphael('diagram', 600, 600), rad = 73;
    r.circle(300, 300, 85).attr({ stroke: 'none', fill: '#193340' });
    var title = r.text(300, 300, 'loading...').attr({
      font: '20px Arial', fill: '#fff'
    }).toFront();
    r.customAttributes.arc = function (value, color, rad) {
      var v = 3.6 * value,
          alpha = v == 360 ? 359.99 : v,
          random = o.random(91, 240),
          a = (random - alpha) * Math.PI / 180,
          b = random * Math.PI / 180,
          sx = 300 + rad * Math.cos(b),
          sy = 300 - rad * Math.sin(b),
          x = 300 + rad * Math.cos(a),
          y = 300 - rad * Math.sin(a),
          path = [['M', sx, sy], ['A', rad, rad, 0, +(alpha > 180), 1, x, y]];
      return { path: path, stroke: color };
    };
    $('.get').find('.arc').each(function (i) {
      var t = $(this),
          color = t.find('.color').val(),
          value = t.find('.percent').val(),
          text = t.find('.text').text();
      rad += 30;
      var z = r.path().attr({ arc: [value, color, rad], 'stroke-width': 26 });
      z.mouseover(function () {
        this.animate({ 'stroke-width': 50, opacity: .75 }, 1000, 'elastic');
        if (Raphael.type != 'VML') { this.toFront(); }
        title.animate({ opacity: 0 }, 500, '>', function () {
          this.attr({ text: text + '\n' + value + '%' }).animate({ opacity: 1 }, 500, '<');
        });
      }).mouseout(function () {
        this.animate({ 'stroke-width': 26, opacity: 1 }, 1000, 'elastic');
      });
    });
  }
};
$(function () { o.init(); });
整體思路很值得借鏡:資料放進 HTML、繪圖交給 Raphael、互動效果用 animate 完成,三者職責分明。想換成自己的統計項目時,只要調整 .arc 的數量與數值即可。