用jquery.easysector.js輕鬆繪製百分比餅圖
編輯:HTML5特效代碼
HTML5 的 Canvas 提供了強大的繪圖 API,讓我們用 JavaScript 就能畫出各式圖形。本文介紹的 jquery.easysector.js 是一個 jQuery 插件,專門用來快速生成百分比餅圖。
先看效果:
https://hovertree.com/texiao/easysector/
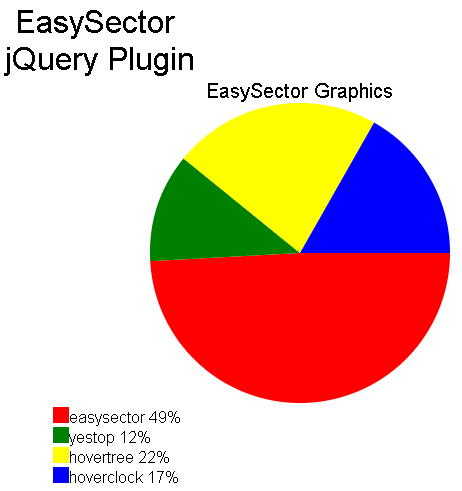
這張圖完全是動態生成的:只要傳入一組比例參數(陣列),它就會依比例繪製扇形;餅圖本身的尺寸也會依 <canvas> 的高度自動調整。
使用步驟
1. 引入 jQuery 與 jquery.easysector.js;
2. 在頁面中放一個容器 div,例如 <div id="easysector"></div>;
3. 用 JS 陣列組出各項資料,呼叫 easysector() 並傳入陣列與尺寸等設定。
完整程式碼
<!DOCTYPE html>
<html>
<head>
<meta http-equiv="Content-Type" content="text/html; charset=utf-8"/>
<title>EasySector - HoverTree</title>
<meta charset="utf-8" />
<style>
a { color: blue }
body { font-family: Helvetica, sans-serif, Arial }
</style>
<script src="https://hovertree.com/ziyuan/jquery/jquery-2.2.0.min.js"></script>
<script src="https://hovertree.com/texiao/easysector/jquery.easysector.1.0.0.js"></script>
</head>
<body>
<div style="width:900px;margin:20px auto">
    <div style="width:100%;text-align:center;font-size:32px">EasySector</div>

    <div style="float:left;width:350px;height:500px">
        <a href="https://hovertree.com">HoverTree</a><br />
        <a href="https://hovertree.com/texiao/easysector/">EasySector Home</a><br />
        <a href="https://hovertree.com/h/bjaf/easysector.htm">Help</a><br />
        <a href="https://www.npmjs.com/package/easysector">NPM</a><br />
        <a href="https://github.com/shangyuxian/easysector">Github</a>
    </div>

    <div style="float:right;width:500px">
        <div id="easysector"></div>
    </div>

    <div style="width:100%;clear:both;"></div>
</div>

<script>
var h_items = new Array();

h_items[0] = { "h_title": "Chrome",  "h_amount": 53, "h_color": "red" };
h_items[1] = { "h_title": "FireFox", "h_amount": 16, "h_color": "yellow" };
h_items[2] = { "h_title": "IE",      "h_amount": 16, "h_color": "green" };
h_items[3] = { "h_title": "Other",   "h_amount": 15, "h_color": "blue" };

$("#easysector").easysector({
    "h_items": h_items,
    "h_title": "Browser Percent",
    "h_width": 260,
    "h_borderColor": "silver",
    "h_poindlength": 0,
    // "h_showamount": true,
    "h_backColor": "#eee",
    "h_recwidth": 20,
    "h_titlesize": 24,
    "h_Radii": 125,
    "h_infosize": 16
});
</script>
</body>
</html>
更精簡的版本可參考:https://hovertree.com/h/bjaf/easysector.htm
參數說明
· h_items:資料陣列,每項含標題、數值與顏色;
· h_title / h_titlesize:圖表標題文字與字級;
· h_width / h_Radii:畫布寬度與扇形半徑;
· h_backColor / h_borderColor:背景與邊框顏色;
· h_recwidth:圖例區塊寬度;
· h_infosize:圖例文字大小;
· h_showamount:是否顯示數值,預設關閉。
如果想完全自製,也可以直接用 Canvas 的 arc() 搭配 moveTo(中心點) 逐段填色,邏輯並不複雜,只是圖例排版與文字對齊需要多花點心思。
- 上一篇文章: 用 HTML5 Canvas 實作貪吃蛇遊戲
- 下一篇文章: 用JavaScript生成植物生長過程動畫特效