Highcharts 座標軸完整設定:標題、標籤、網格線與軸向控制
編輯:關於JavaScript
前言
除了圓餅圖之外,所有圖表都有 X 軸與 Y 軸。預設情況下 X 軸在下方、Y 軸在左側(多 Y 軸時可左右分置)。設定 chart.inverted = true 就能讓兩軸位置對調,這在做條形圖(bar)時會用到。
1. 軸標題
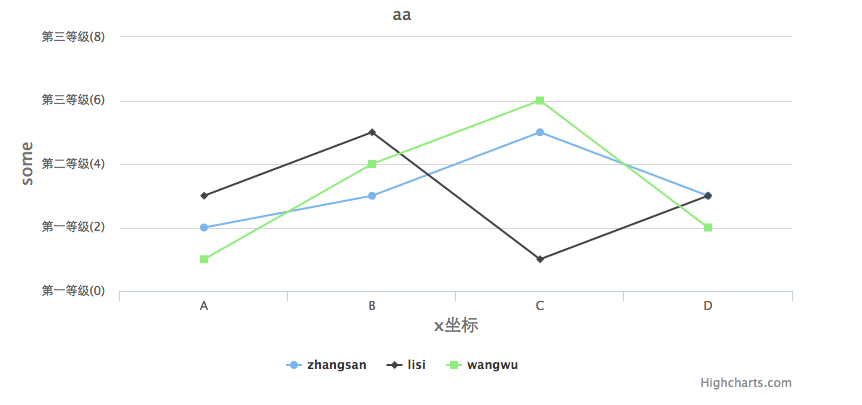
 xAxis:{ title:{ text:'x 軸標題' } }
 yAxis:{ title:{ text:'y 軸標題' } }
2. 軸標籤 labels
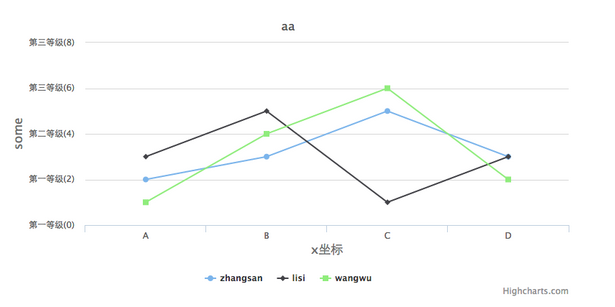
三個常用子屬性:enabled 是否顯示、formatter 自訂格式化函式、step 每隔幾格顯示一次。
 yAxis:{
   labels:{
     enabled: true,
     formatter: function(){
       if (this.value <= 3) {
         return "第一等級(" + this.value + ")";
       } else if (this.value > 3 && this.value <= 5) {
         return "第二等級(" + this.value + ")";
       } else {
         return "第三等級(" + this.value + ")";
       }
     },
     step: 1 // 間隔幾條線顯示一次
   }
 }
3. 網格線
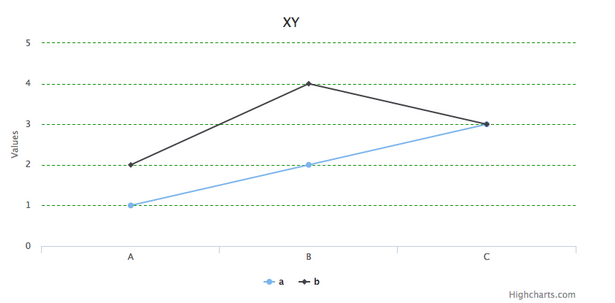
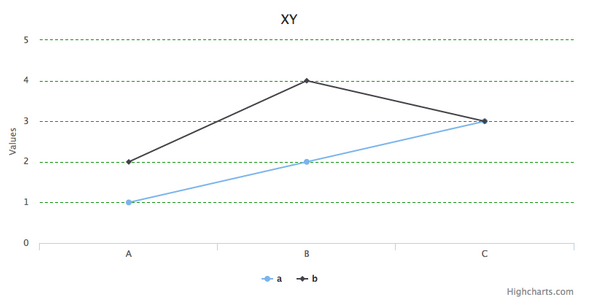
gridLineWidth:網格線寬度。X 軸預設 0(不顯示),Y 軸預設 1px。
gridLineColor:網格線顏色,預設 #C0C0C0。
gridLineDashStyle:線條樣式,概念等同 CSS 的 border-style,常用值有 Solid、Dot、Dash、LongDash 等。
 yAxis:{
   // gridLineWidth: '1px', // 注意:一旦設定了這個屬性,gridLineDashStyle 就會失效
   gridLineColor: '#019000',
   gridLineDashStyle: 'Dash',
 }
4. 軸類型 type
除了預設的線性與類別軸,也常用 datetime(時間軸)、logarithmic(對數軸)。
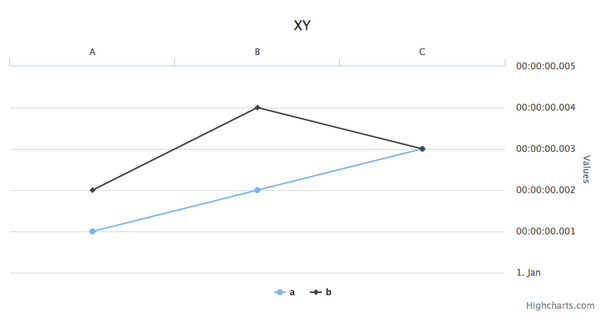
 xAxis:{ categories: ['A','B','C'] },
 yAxis:{ type: 'datetime' },
5. reversed 反轉
reversed 是把軸「翻面」,而不是把 X、Y 對調。Y 軸反轉後,最大值會跑到最下方,最小值反而在頂端。
 xAxis:{ categories: ['A','B','C'], reversed: true },
 yAxis:{ type: 'datetime', reversed: true },
6. opposite 對置
設為 true 時,X 軸與 Y 軸的顯示位置分別上下、左右對調——Y 軸會跑到右側。
 xAxis:{ categories: ['A','B','C'], opposite: true },
 yAxis:{ type: 'datetime', opposite: true }
7. inverted 翻轉整個圖表
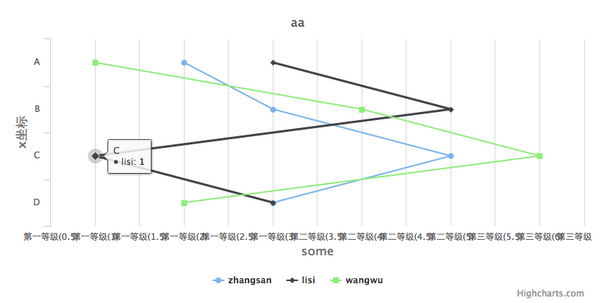
這裡的 inverted 是寫在 chart 底下的,會讓 X、Y 軸實質互換,也就是把折線圖變成橫向的條形圖。
 chart:{
   type: 'line',
   style:{ fontSize: "17px" },
   inverted: true
 }
8. min / max 與 allowDecimals
用來鎖定軸的顯示範圍。這 trio 一起用可以解決很多「數值範圍怪怪的」問題——例如 Y 軸本來從 0 開始,你只想看 80 到 100 的區間,或者不希望出現小數刻度:
 yAxis:{
   min: 80,
   max: 100,
   allowDecimals: false
 }
三個容易搞混的觀念
reversed 是把同一根軸翻面;opposite 是把軸搬到另一側;inverted 是讓 X 與 Y 實質交換角色。三者都跟「軸的位置」有關,但作用層級完全不同,記住這個差別就不會用錯。