網站常有針對某項主題的調查欄目並顯示統計結果。本實例示範公司網站如何實作線上產品意見調查,並以統計圖表呈現結果。
效果說明
使用者對公司產品投票,選項有「很好」、「好」、「一般」、「差」四種。投票提交後,須待下次訪問才能看到自己的投票結果,而圖表顯示的是目前的整體統計。
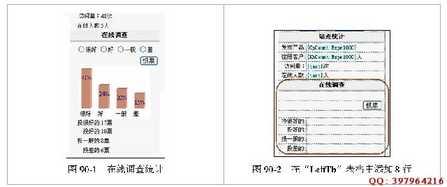
創作構思
透過單選按鈕與按鈕事件實作投票,並以 VML 輸出統計圖表。
步驟一:基本頁面設計
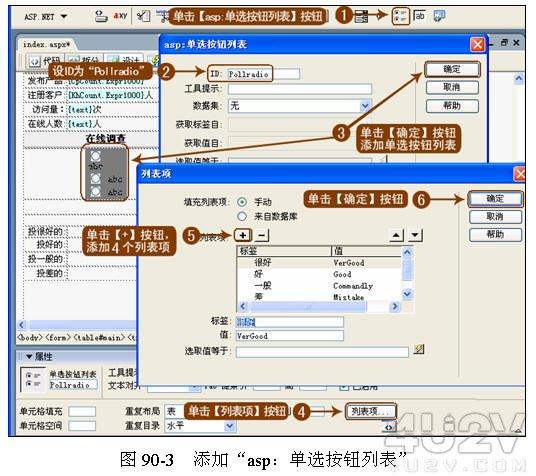
(1) 開啟「index.aspx」,在「LeftTb」表格新增 8 行,於第 3 行加入「asp:Button」,文字設為「投票」、ID 為「PollButton」。
(2) 於第 2 行加入「asp:單選按鈕列表」,設定四個列表項:「很好」值為 VeryGood、「好」值為 Good、「一般」值為 Commandly、「差」值為 Mistake,讓值與 POLL 表的四個欄位名一致。
(3) 新增資料集「PollData」,用來取得四種投票結果。
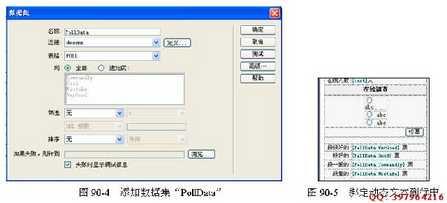
(4) 將 PollData 的動態文字綁定到新增的列中。
步驟二:實作投票與統計圖表
(1) 在 <script runat="server"> 中加入 PollButton_Click 程序,點投票後將結果寫入 POLL 表,並為對應欄位加 1:
Sub PollButton_Click(ByVal sender As Object, ByVal e As System.EventArgs)
 Dim Cpadapter AS new OleDbDataAdapter
 Dim CpCommand AS new OleDbCommand
 Dim dt AS System.Data.DataSet
 Dim Tystring as string
 Conn.open()
 Cpstring2="Update POLL SET "+Pollradio.SelectedItem.Value+"="+cstr(PollData.FieldValue(Pollradio.SelectedItem.Value, nothing)+1)
 CpCommand=new OleDbCommand(Cpstring2,conn)
 CpCommand.ExecuteNonQuery()
 End Sub
由於 Dreamweaver 的「更新記錄」伺服器行為不支援事件處理,只能借助 DataAdapter 物件更新 POLL 表。因為前面已讓選項值與欄位名相同,所以可由 Pollradio.SelectedItem.Value 取得投票欄位名。
(2) 將 PollButton_Click 綁定到投票按鈕的 OnClick 事件。
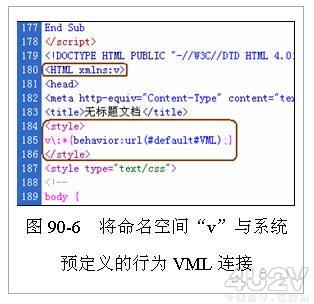
(3) 在 <HTML> 標籤加上 xmlns:v 定義 XML 命名空間,並在 <head> 加入:
<style>
 v:*{behavior:url(#default#VML);}
 </style>
如此便能用 <v:shape></v:shape> 在網頁中繪製圖形。
(4) 刪除原有的 DOCTYPE 宣告。
(5) 加入 DrawPoll 程序輸出統計圖表:
Sub DrawPoll()
Dim Pollar(3) As Integer
Dim TotalPoll As Integer
Dim I As Integer
Dim MathPoll As Single
Pollar(0)=PollData.FieldValue("VerGood", nothing)
Pollar(1)=PollData.FieldValue("Good", nothing)
Pollar(2)=PollData.FieldValue("Commandly",nothing)
Pollar(3)=PollData.FieldValue("Mistake", nothing)
TotalPoll=Pollar(0)+Pollar(1)+Pollar(2)+Pollar(3)
Response.Write("<Table Width='80%' bgcolor='#FFFFFF'><tr alige='center' style='font-size: 9pt ' valign='bottom'>")
For I=0 to 3
MathPoll=Math.Round(Pollar(I)/TotalPoll,2)*100
Response.write("<td Width='25%'><v:rect fillcolor='#FAB092' style='width:20;color:navy;height:"+Cstr(MathPoll*2)+"'><br> "+Cstr(MathPoll)+"%<v:Extrusion backdepth='5pt' on='true'/></v:rect></td>")
Next
response.Write("</tr><tr style='font-size: 9pt '><td>很好</td><td alige='center'>好</td><td>一般</td><td>差</td></Table>")
End Sub
程式將四項結果存入 Pollar 陣列,以 TotalPoll 統計總票數,透過 Response.Write 輸出表格並以 VML 繪製柱狀圖,柱高為該選項占比乘以 2,讓差距更明顯。
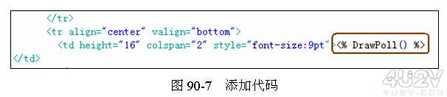
(6) 在要顯示圖表的列加入 <% DrawPoll() %>,存檔後用 IE 預覽。
透過 VML 實作統計分析圖,是目前漸趨流行的方法之一,實務上常以投票比例動態調整圖表寬高來呈現分析結果。
更多精彩教學請持續關注網頁設計教程欄目。
- 上一篇文章: 用 Dreamweaver 打造個性化 Flash 播放介面
- 下一篇文章: Dreamweaver 網頁設計:打造多彩文字連結