ECharts 漸變色柱狀圖:讓長條圖有質感的幾個設定
編輯:JQuery入門技巧
ECharts 是百度開源的圖表庫,效能與弹性都不錯,也早就具備原生 SVG/Canvas 渲染能力,不需要 Flash。這篇要示範的是一個很常被拿來美化報表的元素:柱狀圖加上由上而下的漸層填色。
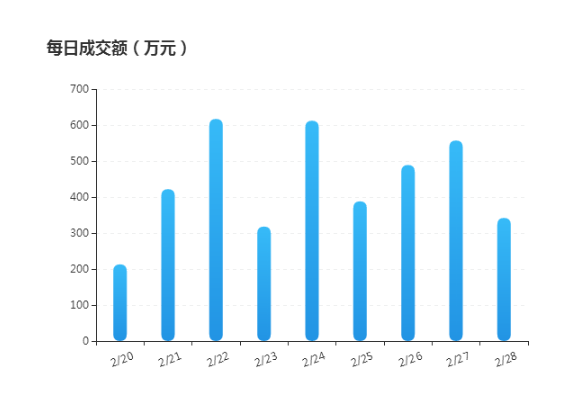
效果圖:
完整程式碼
<!DOCTYPE html>
<html>
<head>
<meta charset="utf-8">
<title>ECharts 柱狀圖</title>
</head>
<body>
<!-- 為 ECharts 準備一個具備寬高的容器 -->
<div id="container" style="width: 600px; height: 400px; margin: 100px auto 20px;"></div>

<script type="text/javascript" src="https://libs.baidu.com/jquery/1.9.1/jquery.min.js"></script>
<script type="text/javascript" src="https://echarts.baidu.com/gallery/vendors/echarts/echarts-all-3.js"></script>
<script type="text/javascript">
var dom = document.getElementById("container");
var myChart = echarts.init(dom);

var xAxisData = [];
var data = [];
for (var i = 20; i < 29; i++) {
    xAxisData.push('2/' + i);
    data.push(Math.round(Math.random() * 500) + 200);
}

var option = {
    title: { text: '每日成交額(萬元)' },

    tooltip: {
        trigger: 'axis',
        borderColor: '#636F7F',
        borderWidth: 1,
        backgroundColor: 'rgba(99,111,127,1)',
        textStyle: { color: '#ffffff', fontSize: 14 },
        transitionDuration: 0.6,
        formatter: '{b0}<br />{c0}(萬元)',
        axisPointer: {
            type: 'line',
            lineStyle: { color: '#05F41E', width: 1, type: 'solid' }
        }
    },

    calculable: true,

    xAxis: {
        data: xAxisData.map(function (x) { return x; }),
        axisLabel: {
            textStyle: { color: '#333', align: 'center', baseline: 'top' },
            rotate: 20,
            margin: 15
        }
    },

    yAxis: {
        type: 'value',
        boundaryGap: false,
        axisLabel: { textStyle: { color: '#333' } },
        splitLine: {
            show: true,
            lineStyle: { color: '#EFF0F0', type: 'dashed' }
        }
    },

    series: {
        type: 'bar',
        data: data,
        barWidth: 15,
        itemStyle: {
            normal: {
                barBorderRadius: 20,
                color: new echarts.graphic.LinearGradient(0, 0, 0, 1, [
                    { offset: 0, color: '#37BBF8' },
                    { offset: 1, color: '#2294E4' }
                ]),
                areaStyle: { type: 'default' }
            }
        }
    }
};

if (option && typeof option === "object") {
    myChart.setOption(option, true);
}
</script>
</body>
</html>
漸層是怎麼做出來的
關鍵在 echarts.graphic.LinearGradient(x, y, x2, y2, colorStops)。前四個參數描述的是渐变方向:從座標 (0, 0) 指向 (0, 1) 代表「由上往下」,若改成 (0, 0) 指向 (1, 0) 就成了左右方向的漸層。colorStops 裡的 offset 是 0 到 1 的位置比例,0 是起點、1 是終點。
其他幾個讓畫面變好看的細節:barBorderRadius: 20 把柱頂磨圓,barWidth: 15 控制柱寬避免過粗,splitLine 用淺色虛線畫分隔線讓數值好讀,xAxis.axisLabel.rotate: 20 則是處理橫軸標籤過長時的標準手法。
值得一提的是,原始範例引用的 ECharts 3 舊版 CDN 位址與 echarts-all-3.js 這種打包檔,在現行版本已經不適用。ECharts 5 之後改成按需引入 echarts/core 搭配 use() 註冊元件,LinearGradient 的寫法也建議改用物件形式的 color: { type: 'linear', ... , colorStops: [...] }。概念不變,但實際上線時請對照目前版本的官方文件。
以上就是本文的全部內容,希望對你的圖表美化有所幫助。