Highcharts 入門:用幾行設定畫出多系列 2D 柱狀圖
編輯:JQuery入門技巧
Highcharts 是前端圖表裡的老牌選手,以 API 直覺、樣式精緻著稱。它最迷人的地方在於:只要給它一個 series 陣列,剩下的座標軸、提示框、圖例、縮放樣式它都幫你處理好了。本文用最簡的配置示範一張多系列柱狀圖。
一、範例程式碼
<!DOCTYPE html>
<html>
<head>
<meta charset="UTF-8">
<title>Highcharts 2D 柱狀圖</title>
<script type="text/javascript" src="js/jquery-1.7.2.min.js"></script>
<script type="text/javascript" src="js/highcharts.js"></script>
<script type="text/javascript">
$(function () {
    $('#columnChart').highcharts({
        chart: { type: 'column' },
        title: { text: '(jb51.net 統計) 2016 年月收入' },
        subtitle: { text: '月收入' },
        xAxis: {
            categories: ['一月','二月','三月','四月','五月','六月',
                         '七月','八月','九月','十月','十一月','十二月']
        },
        yAxis: {
            min: 0,
            title: { text: '收入 (¥)' }
        },
        tooltip: {
            headerFormat: '<span style="font-size:10px">{point.key}</span><table>',
            pointFormat: '<tr><td style="color:{series.color};padding:0">{series.name}: </td>'
                       + '<td style="padding:0"><b>{point.y:.1f} 元</b></td></tr>',
            footerFormat: '</table>',
            shared: true,
            useHTML: true
        },
        plotOptions: {
            column: { pointPadding: 0.2, borderWidth: 0 }
        },
        series: [
            { name: '張三', data: [4995, 7169, 1064, 7292, 2440, 4545, 6545, 9564, 1245, 4512, 6523, 4514] },
            { name: '李思', data: [8361, 2354, 4512, 2356, 4515, 6451, 9865, 5455, 8254, 6562, 6945, 2356] },
            { name: '王武', data: [4512, 9565, 6564, 2652, 3265, 1202, 7845, 9845, 2356, 7844, 5424, 6312] },
            { name: '趙六', data: [6523, 8956, 6531, 6532, 9864, 4552, 9564, 7845, 6523, 4512, 8956, 2356] }
        ]
    });
});
</script>
</head>
<body>
<div id="columnChart" style="width: 1200px; height: 500px; margin: 0 auto"></div>
</body>
</html>
二、執行結果
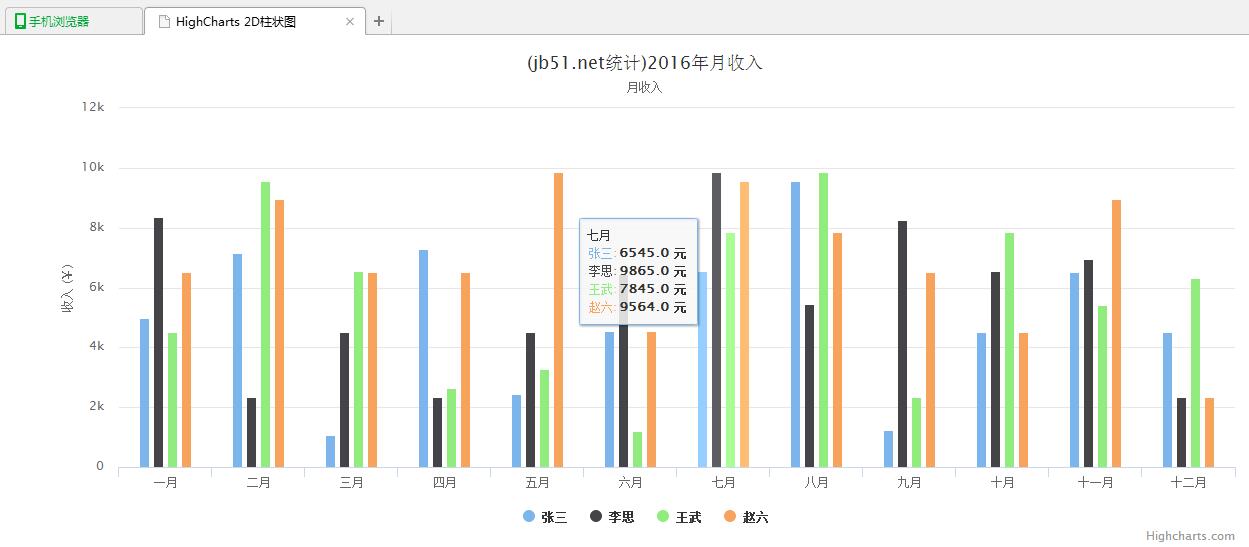
附:完整範例程式碼可於本站下載。
幾個值得學的設定
tooltip 的 shared 與 useHTML。 shared: true 讓滑過某個月份時,四個人的數值一次全部顯示在同一個提示框裡,這對多系列比較是關鍵。useHTML: true 則允許你在提示框裡寫 HTML,所以 headerFormat/pointFormat 才能用 <table> 排版,甚至用 {series.color} 讓文字顏色跟著系列走。
pointPadding 與 borderWidth。 這兩個是柱狀圖美觀的關鍵。柱寬太粗會顯得笨重,pointPadding: 0.2 在每組柱子間留出呼吸空間,borderWidth: 0 去掉預設描邊讓顏色更純粹。
yAxis.min 設為 0。 柱狀圖的高度是「從基線起算的長度」,若 y 軸不從 0 開始,柱子長度的比例就會失真,容易誤導讀者。這條規則幾乎適用所有柱狀圖,務必養成習慣。
最後提醒,Highcharts 商用需取得授權,個人與非營利用途可免費使用;上線前請確認自己的使用情境符合其授權條款。
希望本文所述對你的 Highcharts 開發有所幫助。
熱門推薦
FusionCharts 實戰(一):用 jQuery 繪製 2D 帕累托圖
用 jQuery 做一個假的載入動畫,改善等待體驗
用 PHP、jQuery 與 Ajax 打造無刷新分頁的完整實作
bind() 已經過時了:全面改用 on() 的理由與事件代理實戰
動手寫一個 minijQuery:從源碼理解 jQuery 選擇器的實現原理
jQuery bind 與 unbind:按鈕點擊事件的動態加減
用純 jQuery 做一個前端驗證碼:產生、點擊刷新與比對
使用 jQuery 讓搜尋框支援 Enter 鍵送出
jQuery 外掛 ajaxFileUpload 實戰:參數配置、常見錯誤與後端搭配