Bootstrap 圖表元件 Chart.js 使用教學
編輯:關於JavaScript
Bootstrap 由 Twitter 的 Mark Otto 與 Jacob Thornton 開發,提供了一套優雅的 HTML 與 CSS 規範。它的影響力早已超出「框架」本身——它讓大量原本需要反覆手刻的頁面結構變成了標準化的元件,大幅降低了應用與網站的設計門檻。
圖表元件 Chart.js 是 Bootstrap 生態裡相當好用的一個選擇。它和付費的 Highcharts 功能上有不少重疊,免費與付費在細節呈現上仍有些差距,但應付專案需求大致足夠。
下面這段腳本封裝了一個「產生圖表設定檔」的方法,目的是讓後續新增圖表時不必重複堆疊設定:
 /**
 * 取得一份新的 chart 設定
 * @param color rgba 顏色
 * @param type 圖表類型:line, bar, radar, polarArea, pie, doughnut
 * @param title 圖表標題
 * @param label 圖表標籤,滑鼠移到數據點時顯示的提示文字
 * @param categories 通常是 X 軸內容
 * @param data 通常是 Y 軸數據
 * @returns 圖表設定物件
 */
function getNewConfig(color, type, title, label, categories, data) {
  var background = color;
  var config = {
    type: type,
    options: {
      responsive: true,
      legend: {
        display: false,
        position: 'bottom'
      },
      hover: {
        mode: 'label'
      },
      scales: {
        xAxes: [{
          display: true,
          scaleLabel: {
            display: false,
            labelString: 'Month'
          }
        }],
        yAxes: [{
          display: true,
          scaleLabel: {
            display: false,
            labelString: 'Value'
          }
        }]
      },
      title: {
        display: true,
        text: title
      }
    }
  };
  var dataset = {
    label: label,
    data: data,
    fill: false,
    borderDash: [5, 5],
    borderColor: background,
    backgroundColor: background,
    pointBorderColor: background,
    pointBackgroundColor: background,
    pointBorderWidth: 1
  };
  var data = {
    labels: categories,
    datasets: [dataset]
  };
  config.data = data;
  return config;
}
呼叫方式:先準備一個 canvas,再把設定物件餵給 Chart 建構式。
 <canvas id="chart_weixinmember" height=""></canvas>
var color = 'rgba(0, 123, 255, 0.8)';
var categories = ["--","--","--","--","--","--","--"];
var data = [10, 20, 30, 40, 50, 60, 70];
var config = getNewConfig(color, 'line', '最近7天微信會員增長情況', '當天新增微信會員', categories, data);
var ctx = document.getElementById("chart_weixinmember").getContext("2d");
var weixinMemberCountChart = new Chart(ctx, config);
呈現結果:
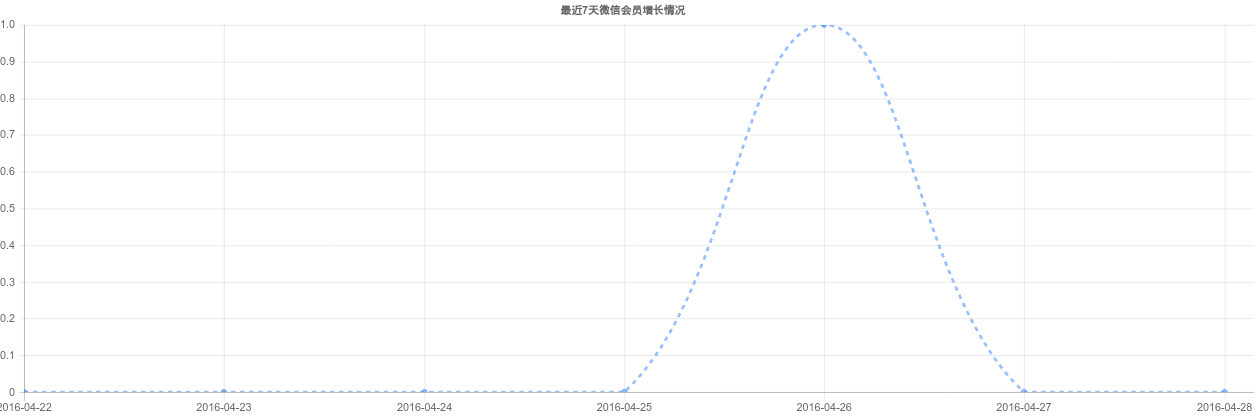
提醒:使用前必須先載入 Chart.js。中文文件與英文官網可參考 https://www.bootcss.com/p/chart.js/ 與 www.chartjs.org,兩邊都附有完整的 API 說明。
- 上一篇文章: 用 JS 模擬手機九宮格手勢密碼登入(含完整邏輯)
- 下一篇文章: JS 手寫 Base64 加解密:原理與完整範例